
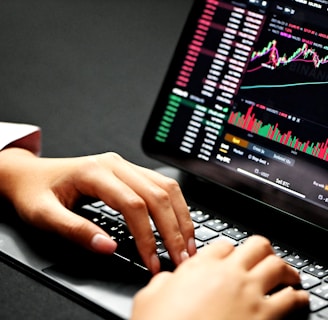
Hands typing on a laptop keyboard with a screen displaying financial graphs and stock market data. Multiple charts and numbers are visible, indicating online trading or financial analysis.

Investimento em ações

A close-up view of a financial newspaper page showing stock index performance. It includes flags indicating countries such as the United States, Canada, and Brazil alongside their respective stock indices like Dow Jones and S&P 500. Figures show numerical values and percentage changes, some in red indicating a decrease and some in green for an increase.
Investimento em Ações

Aprenda a dominar o mercado com estratégias profissionais e descubra como maximizar seus lucros em ações de alto potencial.

500$

Preço do Curso

A smartphone is placed on a white desk showing a stock trading app with a line graph and financial details. Next to the phone is the keyboard of a laptop, and a white cup is in the top left corner.
Estratégias de Sucesso

Descubra métodos eficazes para identificar oportunidades de investimento e gerenciar riscos, garantindo um retorno seguro e lucrativo.

Valor do Curso

300$

A hand holding a smartphone displaying a colorful line graph with various candlestick patterns, indicative of financial or stock market data. The background consists of a textured, woven fabric surface in neutral tones.
Análise de Mercado

Entenda as tendências do mercado e os fluxos de capital para tomar decisões informadas e estratégicas em seus investimentos.

Custo do Curso

400$